02 February 2021, Munich – In spring 2020, when the corona pandemic started spreading around the globe, many efforts were made to treat infected patients with existing drugs. Especially paracetamol made headlines due to recommendations by several governments and the World Health Organization. Paracetamol is commonly used for pain relief and fever reduction, and was thought to mitigate common symptoms of a CoViD-19 infection such as fever, body aches and headaches.
At that time, there were also concerns that some related drugs (e.g. ibuprofen), might have an adverse effect during a CoViD‐19 infection. As a result of these two factors – several recommendations for paracetamol and warnings against other drugs – the demand for the API increased rapidly in March/April 2020.¹
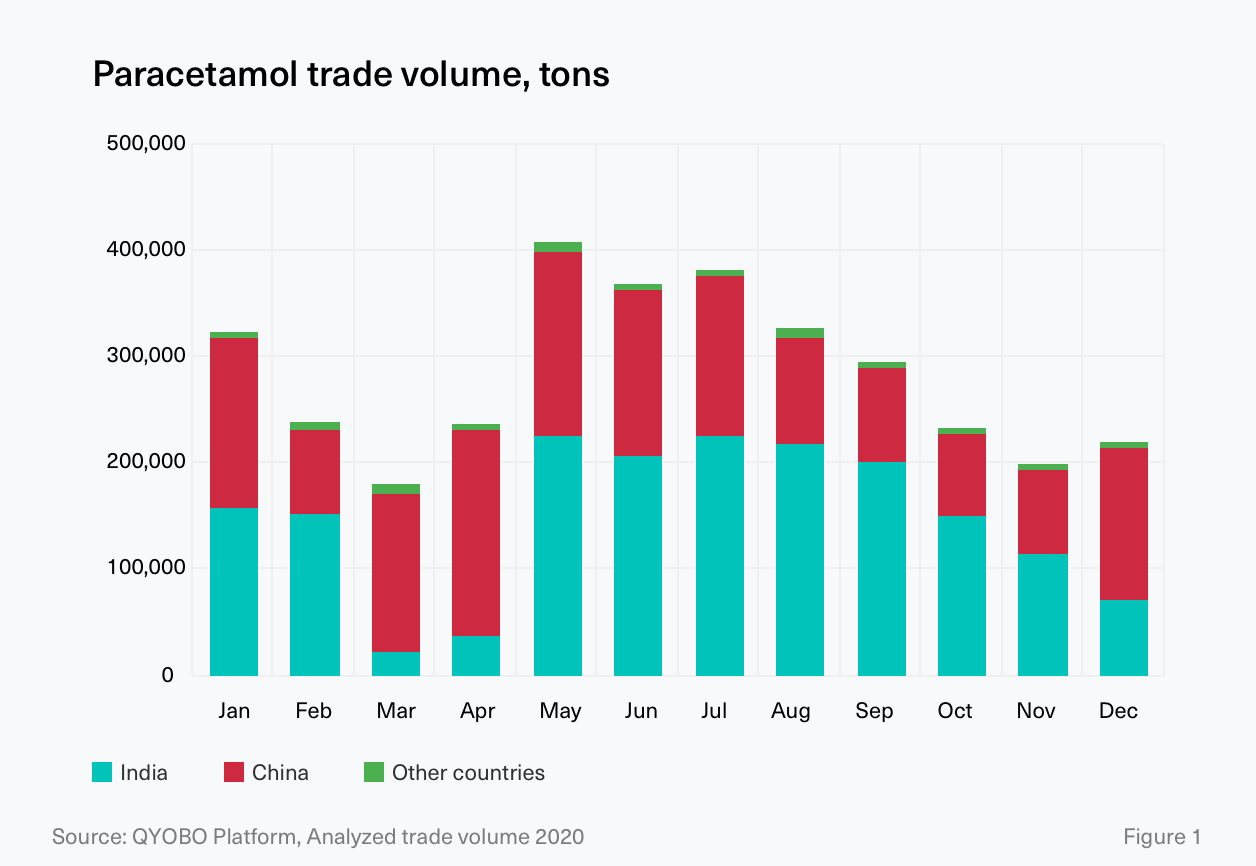
On March 3rd, 2020, amidst a rapidly rising number of CoViD‐19 infections, India – next to China the key manufacturing country for paracetamol – announced export restrictions on several APIs and formulations including paracetamol.² As a result, trade volumes from India almost came to a complete standstill in March and April 2020 before the export ban was lifted again on the 28th of May.³ (see Figure 1)

As the majority of the world’s demand for APIs is met by manufacturing sites in India or China (see Figure 2.1, see also QYOBO article), the hard lockdown and the export restrictions in India had a tremendous impact not only on the market dynamics and availability of paracetamol but also on its intermediates (a.k.a key starting materials, KSMs) as worries about the general resilience of global supply chains grew.


The intermediates for paracetamol production are mainly manufactured in Asia. While exporters of 4-aminophenol are located predominantly in China, the majority of hydroquinone exporters are based in India and Japan (Figure 2.2). And even though the API supplier landscape is fairly fragmented with dozens of traders in India and China, only a handful of API manufacturers remains – most notably Farmson, Granules India, Sri Krishna (all India), Anqiu Lu’an Pharmaceutical, Hebei Jiheng, Zhejiang Kangle (all China), as well as Mallinckrodt (USA) and Atabay Turkey – the only major manufacturers outside of South and East Asia. In the first quarter of 2020 the price for paracetamol continued its long-term price decrease, reaching a low of 3.92 USD/kg in March. At the end of March, a rapid price increase – which should continue for 14 weeks (until mid-July) – set in, pushing prices to a peak of 5.87 USD/kg (50 % increase, March-July 2020). Subsequently, the price fluctuated between 5.19 USD/kg and 5.84 USD/kg until the end of the year (Figure 3). In summary, the price of paracetamol ranged between a low of 3.92 USD/kg (-23.3%) and a high of 5.86 USD/kg (+14.9%) with a full-year average price of 5.11 USD/kg. (Figure 3.1)
In addition to detailed price trends, the QYOBO platform also makes it possible to differentiate between various qualities and grades which tend to have a profound impact on the price dynamics. By pharmacopeia, the lowest prices in 2020 were for paracetamol conforming with the Indian Pharmacopeia (IP) with -15 % compared to the average price across all trades, whereas paracetamol conforming with the European Pharmacopeia (EP) turned out to be moderately more expensive than the market average (+6.3 %, see Figure 3.2). In comparison to the pharmacopeia, the addition of further processing steps, e.g. micronization has a more pronounced impact. Micronized and directly compressible (DC) grades prices are significantly more expensive with prices +33 % and +130 % higher than the average market price.

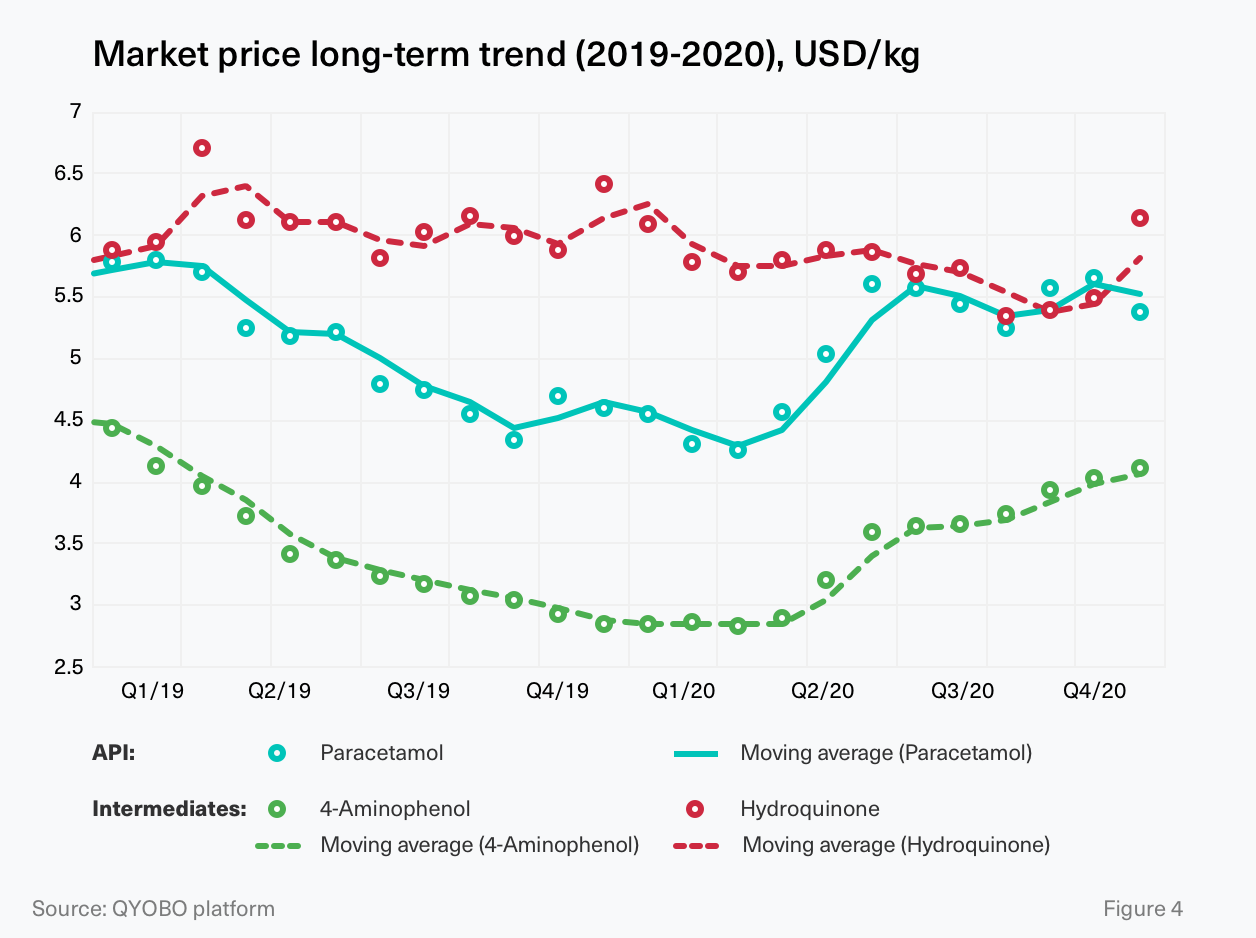
Allowing for a further deep-dive into global supply chains, the QYOBO platform now also covers intermediates, such as 4-aminophenol (a.k.a. “PAP” for para-aminophenol) and hydroquinone for paracetamol. Figure 4 highlights a strong correlation between the price dynamics of paracetamol and 4-aminophenol. Both substances continued their long-term price decrease into early 2020. Within just a couple of weeks, starting in March 2020, these price trends were reversed as the “CoViD effect” kicked in, pushing prices back up to levels last seen at the beginning of 2019.
In contrast, no direct correlation could be observed between paracetamol and hydroquinone, suggesting that other uses for hydroquinone outweigh the effects of a change in paracetamol demand. While decreasing in the long-term, hydroquinone prices abruptly increased in the last quarter of 2020 experiencing the most significant growth of 12 % in December 2020 (compared to November 2020, see Figure 4)

With strong correlations between the market dynamics for an API and its intermediates, it is becoming increasingly important to understand supply chains beyond tier 1 suppliers (API supplier). With the lessons learned from 2020, QYOBO supports its partners in analyzing, understanding and anticipating market trends for APIs (tier 1), intermediates (tier 2) and base chemicals (tier n) alike – feel free to reach out for a personalized demo.
Approach
Price curves
Prices are weighted average prices (weighted by trade volume) for each month. Prices reflect FOB prices (free on board), excluding freight or insurance cost. The price curves for a given substance include data points for all known salts for this substance.
Source
This report has been generated leveraging the QYOBO market analytics platform. The big-data powered platform combines trade data, regulatory information and further enriching financial data on the market from a large variety of distributed databases around the globe. For its API benchmarks, QYOBO processes over 25 million trade datasets from 20 countries (e.g. Argentina, Chile, China (partially), India, Kenya, Mexico, Russia, the USA, Vietnam) in 8 languages. The time frame assessed for this analysis was January 2019 through December 2020.
Glossary
![]() Active pharmaceutical ingredient
Active pharmaceutical ingredient
![]() Key starting materials
Key starting materials
![]() Indian Pharmacopeia
Indian Pharmacopeia
![]() European Pharmacopeia
European Pharmacopeia
![]() United States Pharmacopeia
United States Pharmacopeia
![]() Directly compressible
Directly compressible
About QYOBO GmbH
QYOBO GmbH is a Munich-based tech company providing actionable market insights on the API, excipient and chemical markets. The company has developed proprietary big data algorithms to process and enrich data from a large variety of distributed data sources. Leveraging this expertise, QYOBO provides its clients with a one-stop solution to benchmark prices, analyze trends, identify relevant trading partners and streamline adjacent sales and procurement workflows.
QYOBO’s clients include API manufacturers and pharmaceutical companies in Europe and beyond. In 2019, QYOBO won BASF’s Digital Market Challenge against over 100 startups worldwide. In 2020, the company has been recognized as a “Digital Innovation” by the German Federal Ministry of Economic Affairs and Energy (BMWi) and is one of the 10 most innovative startups according to WECONOMY/Handelsblatt.
For further information please contact:
Ms. Thuy Linh Nguyen, Corporate Communications
communication@qyobo.com
www.qyobo.com
Disclaimer: The information in this article is not intended to be used for medication purposes. Please do not self-medicate and consult a physician/doctor for any questions with regard to your personal medical needs. This assessment has been prepared adhering to the highest quality standards based on a variety of external data sources (see sources) with the purpose of making distributed information accessible to a broader audience. The information contained in this document is provided on an “as is” basis and QYOBO GmbH assumes no responsibility or liability for the completeness, accuracy, usefulness or timeliness of the information provided. This article contains links to external websites operated by third parties upon which QYOBO GmbH has no influence. QYOBO GmbH does not assume any guarantee or liability for third party content.
¹ LearnAboutCovid-19, 05 August 2020.
Is paracetamol effective in treating or curing COVID-19?
² Government of India, 03 March 2020.
Amendment in Export Policy of APIs and formulations made from these APIs.
³ India Today, 28 May 2020.
Govt allows export of paracetamol API.